Data Analytics & BI Dashboards
Are your competitors making faster decisions with data you can't even see? What's hiding in your numbers right now?
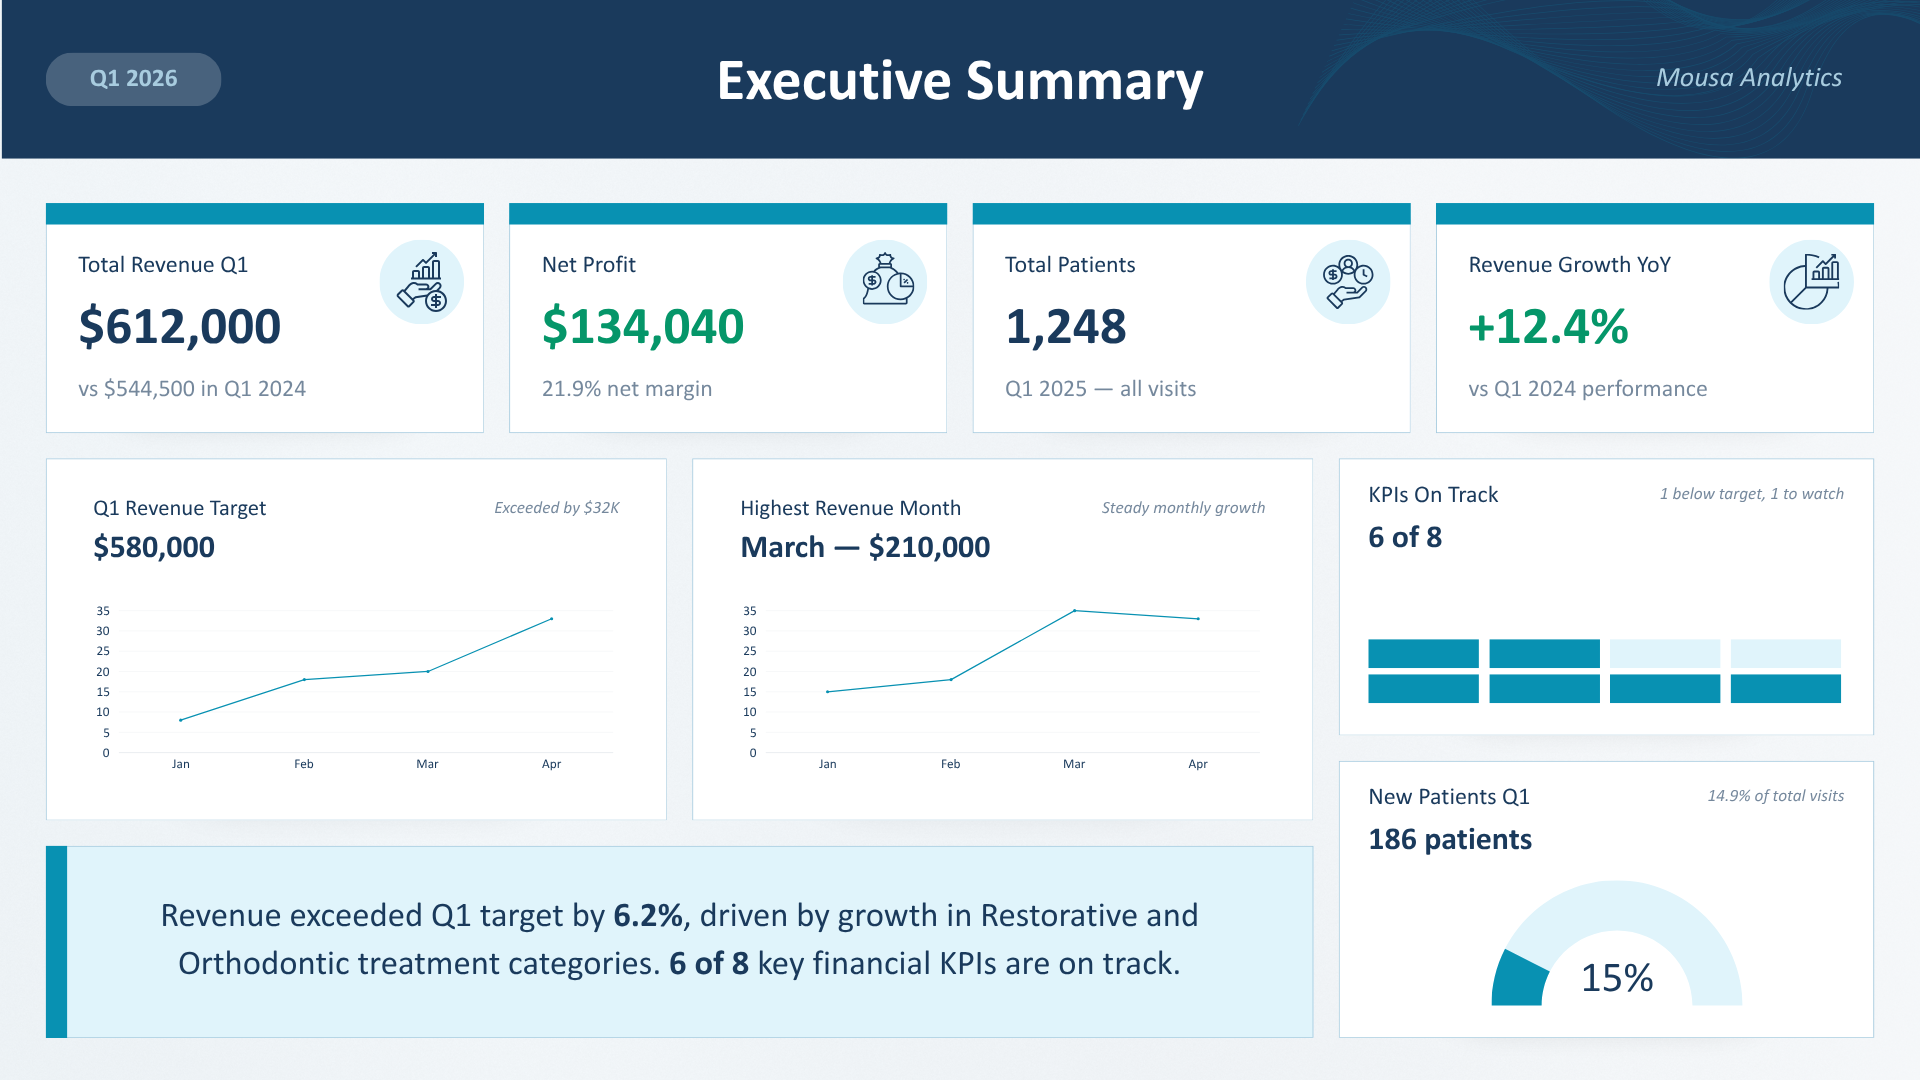
Executive Summary
Stop making decisions in the dark. I transform raw databases into robust Power BI dashboards and clean SQL models, mapping out every bottleneck in your operations and marketing to drive actionable growth.
What I Will Do (Scope of Work)
- 01 Interactive Sales & KPI Dashboards
Analyze your current POS, Google Sheets, or CRM databases to map data flows.
- 02 Real-time ROI Tracking
Utilize SQL and advanced Excel to clean, format, and structure 100% of anomalies.
- 03 Custom SQL Queries & Data Modeling
Build an interactive Star Schema model in Power BI with weekly automated refreshes.
- 04 Data Cleaning & Processing
Code custom DAX measures to track CPA, ROAS, seasonal variations, and profit margins.
What You Will Get (Business ROI & Deliverables)
- Instant clarity on peak hours, high-margin products, and operational bottlenecks.
- A fully tailored interactive dashboard with filterable views for different roles.
- Save 10+ hours weekly by replacing manual data processing with automated systems.
- Detailed action plan outlining the top 5 areas to immediately cut cost and scale.
Frequently Asked Questions
What data sources and databases do you support?
I support integration with SQL databases (MySQL, PostgreSQL, SQL Server), Google Analytics (GA4), e-commerce platforms like Shopify and WooCommerce, CRMs such as HubSpot, and standard spreadsheets like Google Sheets & Excel.
How do you ensure the privacy and security of my business data?
We sign a formal Mutual Non-Disclosure Agreement (NDA) before any credentials or datasets are shared. Additionally, I strictly request read-only database permissions whenever possible to maintain security integrity.
Do the dashboard metrics update automatically?
Yes. Using Power BI Cloud Service or Looker Studio integrations, I set up scheduled automated refreshes (daily, hourly, or weekly depending on requirements) so you always see fresh, accurate metrics.
How long does a typical dashboard project take?
A typical deployment takes 10 to 15 business days. This timeframe covers data pipeline auditing, schema modeling, custom measure coding (DAX/SQL), dashboard interface design, and a hands-on video training walk-through.
Accept Proposal & Start Project
Ready to transform your business data and marketing efficiency? Click below to accept this proposal and start collaborating directly on WhatsApp.
Related Case Studies for this Service:
- Case Study Coffee Shop Sales & Optimization
- Case Study Oxygen Gym Financial Transformation
- Case Study Chinook Music Store Analysis
- Case Study Fuzzy Factory Data Analytics
- Case Study SQL Practice Journey - Level 2
- Case Study SQL Practice Journey - Level 1
- Case Study Walmart Sales Performance Analysis